If you roll a pair of dice 36 times, the expected number
of times for rolling each of the numbers is given in the
accompanying table. A graph of these data is shown.
a. Find the mean, the variance,
and the standard deviation for this model.
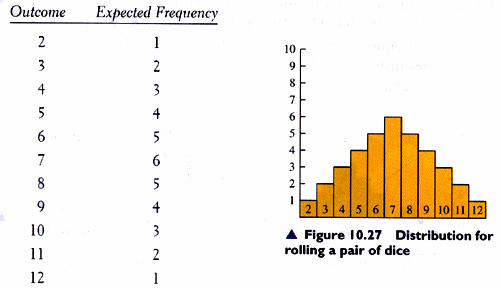
b. Roll a pair of dice 36 times.
Construct a table and a graph similar to the ones
shown in Figure 10. Find the
mean, the variance, and the standard deviation for
your experiment.
c. Compare the results of parts a
and b. If this is a class problem, you might wish to
pool from the entire class data before
making the comparison.
Individual Research Project 14.4
Prepare a report or exhibit showing how statistics are
used in baseball.
Prepare a report or exhibit showing how statistics are used
in educational testing.
Prepare a report or exhibit showing how statistics are used
in psychology.
Prepare a report or exhibit showing how statistics are used
in business. Use a daily report of transactions on the New
York Stock Exchange. What inferences can you make from the
information reported?
Investigate the work of Adolph Quetelet, Francis Galton,
Karl Pearson, R. A. Fisher, and Florence Nightingale.
Prepare a report or an exhibit of their work in statistics.
Historical Quest
"We need privacy and a consistent wind, " said Wilbur.
"Did you write to the Weather Bureau to find a suitable
location? "
"Well, " replied Orville, "I received this list of possible
locations and Kitty Hawk, North Carolina, looks like just
what we want. Look at this . . . "
However, Orville and Wilbur spent many days waiting in
frustration after they arrived in Kitty Hawk, because
the winds weren't suitable. The Weather Bureau's information
gave the averages, but the Wright brothers didn't realize
that an acceptable average can be produced by unacceptable
extremes.
Write a paper explaining how it is possible to have an
acceptable average produced by unacceptable extremes.